CDMS Testing
Data Sheets for Combustion Dynamics Monitoring Systems
- CDMS System for use in General Electric Frame 7 and 9 gas turbines
- CDMS System for use in Siemens 501 series of gas turbines

Over 2,000,000 Hours of Time in Service!
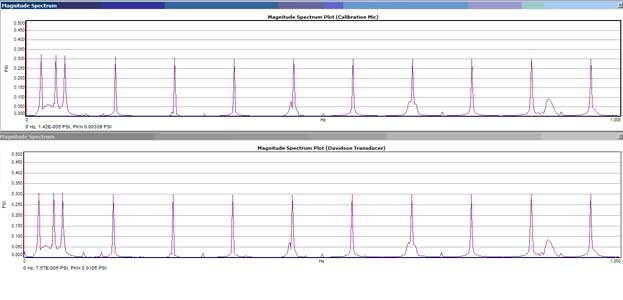
Comparison of Davidson GE 7FA Transducer with a Laboratory-Grade Calibration Microphone in Pure-Tone Laboratory Test at 0.3psi
High Fidelity Testing - The following chart demonstrates the high-fidelity response of Davidson's CDMS sensors.
The signal in the top graph is the output of a laboratory reference laboratory calibration microphone in response to pure tones generated at 25 Hz and 65 Hz and then at 50 Hz to 950 Hz in 100 Hz increments at 0.3 psi. The signal in the bottom graph is the output of the Davidson GE 7FA-style transducer taken at the same time.
Note the Davidson transducer and the reference laboratory calibration microphone are in the same acoustic chamber at a 90° orientation relative to one another. The Davidson transducer faithfully reproduces the sound pressure without any falloff at either low or high frequencies. In fact, the Davidson transducer faithfully reproduced every acoustic anomaly seen by the reference microphone.
The fidelity of Davidson's transducers is as good at the 800°F operating temperature inside the engine as the high-performance laboratory calibration microphone is at room temperature. This means all acoustic events across the spectrum will be faithfully reported by the Davidson system without any drop off, distortion, or blind spots in the spectrum.
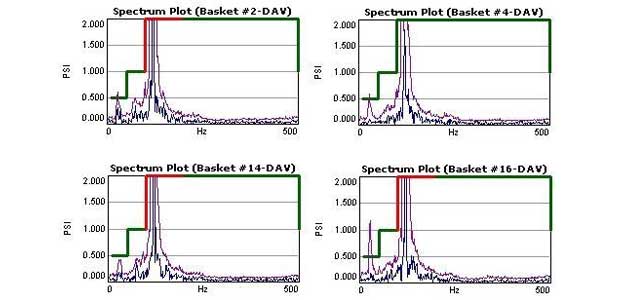
Field Test Results of Davidson 501F Transducers Illustrate the Low Frequency Precursor to a Lean Blow Out
Lean Blow Out (Low Frequency Sensitivity) Testing - A lean blow out occurs when the fuel to air mixture is so lean, the engine cannot sustain combustion. A lean blow out is typically preceded by low frequency dynamics at 25Hz.
The four graphs on the figure above show abnormal combustion signals in a Siemens 501F engine at 25Hz. In three of the four graphs, there is a peak hold signal (purple line) that shows abnormally high low frequency dynamics which have not gotten into an alarm condition yet. The blue signal (real time signal) is below the alarm setpoint but this engine is running very lean and is close to a lean blowout.
Davidson's system is clearly able to detect and accurately measure the low frequency dynamics providing operators and/or automated control systems with alarms and time to adjust the fuel mixture to avoid a lean blowout.
If the engine had been allowed to continue running at this condition, it could have resulted in a loss of power and possible severe damage to the engine.
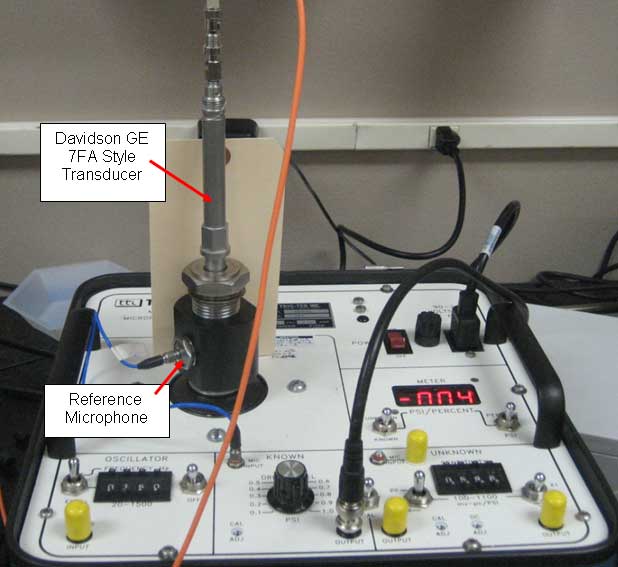
Laboratory Test Setup Generating Pure Tones from 10 to 1000 Hz
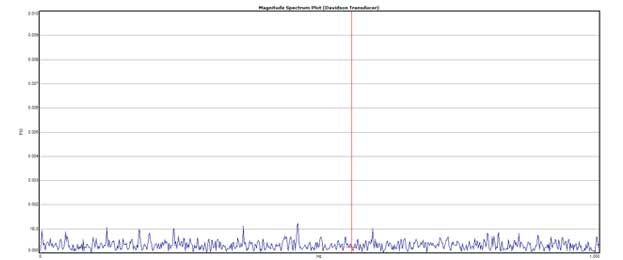
Davidson's Ultra Low Noise Floor of 0.001 psi Provides a Great Signal to Noise Ratio
Ultra-low Noise Testing – Combustion dynamics are violent acoustic events like thunder and are caused by the collapse of the flame in a combustor. If it becomes important to detect very small combustion events, you need to know the noise floor for the system. Although our acoustic testing apparatus is not able to generate very small acoustic signals, we are able to measure the noise floor in the presence of a pure tone signal.
The test apparatus was a pure tone acoustic source that generated pure sinusoidal pressure waves at 0.25 psi. We used the source to generate pure tones from 10 to 1000 Hz in approximately 50 Hz increments.
The graph above shows the ultra-low noise performance of the Davidson transducer. The noise floor is uniformly less than 0.001 psi across the spectra and this provides evidence that the Davidson system will report the actual acoustic events caused by real combustion dynamics and not false indications caused by electrical noise, thermal transients, etc
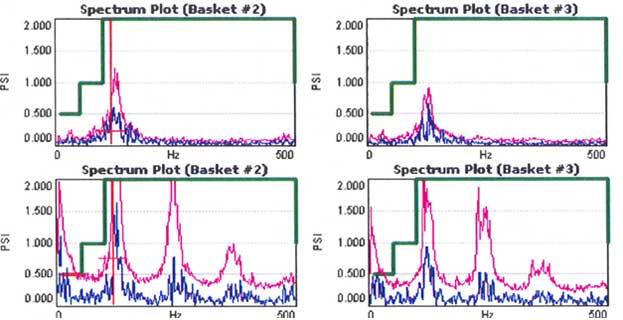
Normal Dynamics at 150MW and Abnormal Dynamics at 160MW Minutes Apart
High Dynamics at High Power
In the following figure, the top two graphs show normal combustion signals in a Siemens 501F engine operating at 150MW.
In the same figure, the bottom two graphs show abnormal combustion signals in the same engine only minutes later after the power output was increased to 160MW.
Interestingly, that day, the normal combustion dynamics signal appeared whenever the engine was generating 150MW or less and the abnormal signals appeared whenever the engine was generating 160MW or more.
If the engine had been allowed to continue running at 160MW or higher, it would have resulted in severe damage to the engine. In this case, by monitoring the combustion dynamics and cutting back power by 10 MW, the alert operator was able to nurse the engine along until a service outage could be scheduled.

